

Evaluating Environmental Interventions in the Yellow Sea during the Pandemic

Geeta Batra
GEF Independent Evaluation Office (GEF IEO)
Chief Evaluation Officer

Gabriel Sidman
GEF Independent Evaluation Office (GEF IEO)
Evaluation Officer
Blog Date:
Introduction
This blog is the second in our series to address challenges in evaluating impacts of environmental interventions during the pandemic. The Global Environment Facility enters the eighth replenishment process in Spring next year. The Independent Evaluation Office plays a significant role in informing the replenishment process through a comprehensive evaluation of the GEF, and donors are increasingly challenging us to report not just on outcomes at project closure but also on long term sustainability of outcomes. COVID-19 hasn’t made it easy for evaluators: we can’t visit program sites we had planned to evaluate, or interview participants in person, or otherwise conduct assessments as we normally would. Our innovative abilities are being put to the test to address key questions of interest to donors—what are the outcomes of GEF interventions? More importantly, are these outcomes sustainable years after project closure? To answer these important questions, we are fortunate enough to be able to draw on existing data to measure environmental outcomes over a long period of time using remote sensing and geospatial analysis. We recently published a paper wherein we present an example of our efforts under quarantine to assess the sustainability of outcomes of GEF interventions in the Yellow Sea using satellite and other geospatial information, combined with interviews. We demonstrate that the “new normal” has provided us with opportunities to fully exploit existing data sources which are readily available. While the methods we explore and the data are not perfect to address all issues, such as attribution, they offer a reliable and replicable approach to the estimation of environmental outcomes.
The GEF in the Yellow Sea
GEF has a long history of investing in the Yellow Sea Large Marine Ecosystem (YSLME), a semi-enclosed sea located between China to the west and the Korean peninsula to the east. Since 1992, at least 15 projects have focused on reducing marine pollution in the YSLME, through diverse interventions such as preventing the dumping of ship waste, promoting integrated coastal management demonstration sites, forming regional partnerships to promote international cooperation in scientific investigation and ecosystem management and improving the waste management infrastructure of the surrounding cities. Despite the best intentions, reducing marine pollution in the YSLME is a gargantuan task. The YSLME is surrounded by megacities such as the Beijing-Tianjin metropolitan area in China, Pyongyang, Democratic People’s Republic of Korea and Seoul-Incheon, Republic of Korea—all of which have grown precipitously over the last 50 years. All the economic bustle of these areas has created pollution. The Bohai Sea, which is the most northern portion of the YSLME, receives about 40% of the direct discharged sewage from all of China while only having 2.6% of its sea area. Furthermore, geography is not helping—the YSLME is semi-enclosed and shallow—meaning nutrients and other pollutants tend to remain trapped in its waters without mixing with the larger ocean beyond, causing frequent algal blooms and destruction of habitat for key species. Up against all these challenges, how well has GEF done at improving the water quality in the YSLME? Satellite data helped us answer this question. Satellites are able to detect differences in ocean color, which is useful in understanding water quality because clear water and nutrient-rich water have different spectral signatures. The presence of one detectable pigment, chlorophyll-a (chl-a), can indicate whether or not nutrient levels, and therefore pollution levels, are high in ocean water.
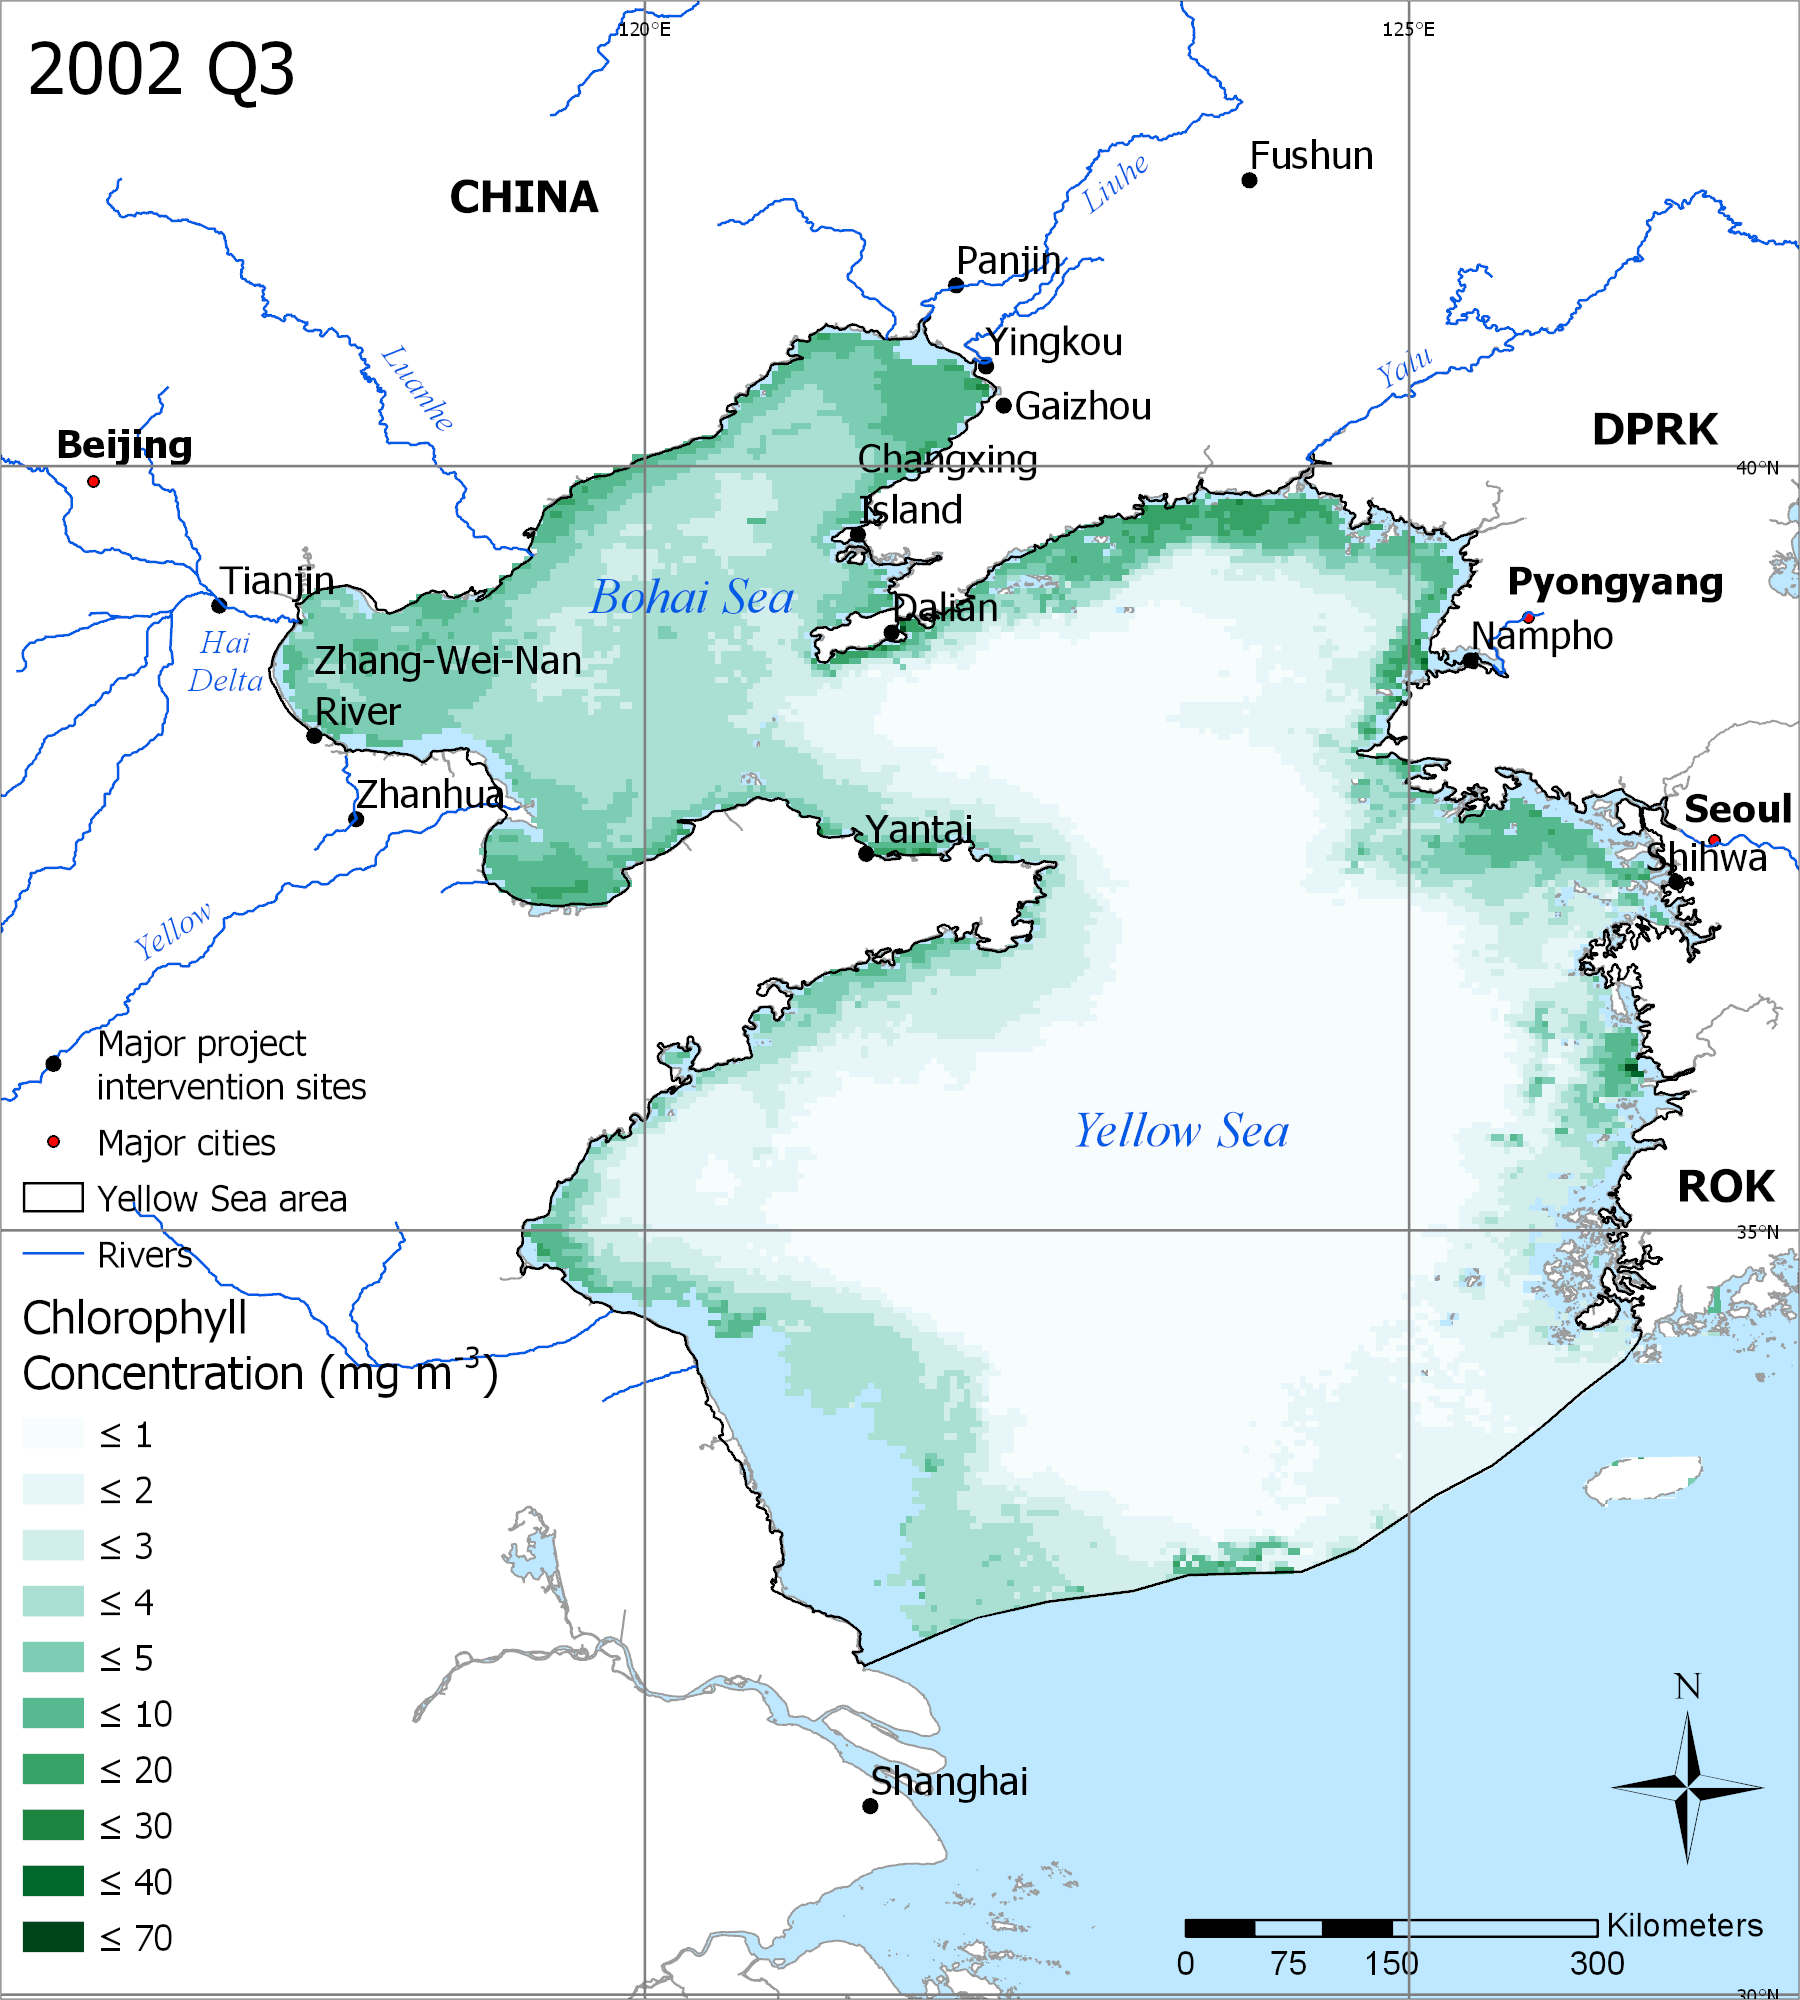
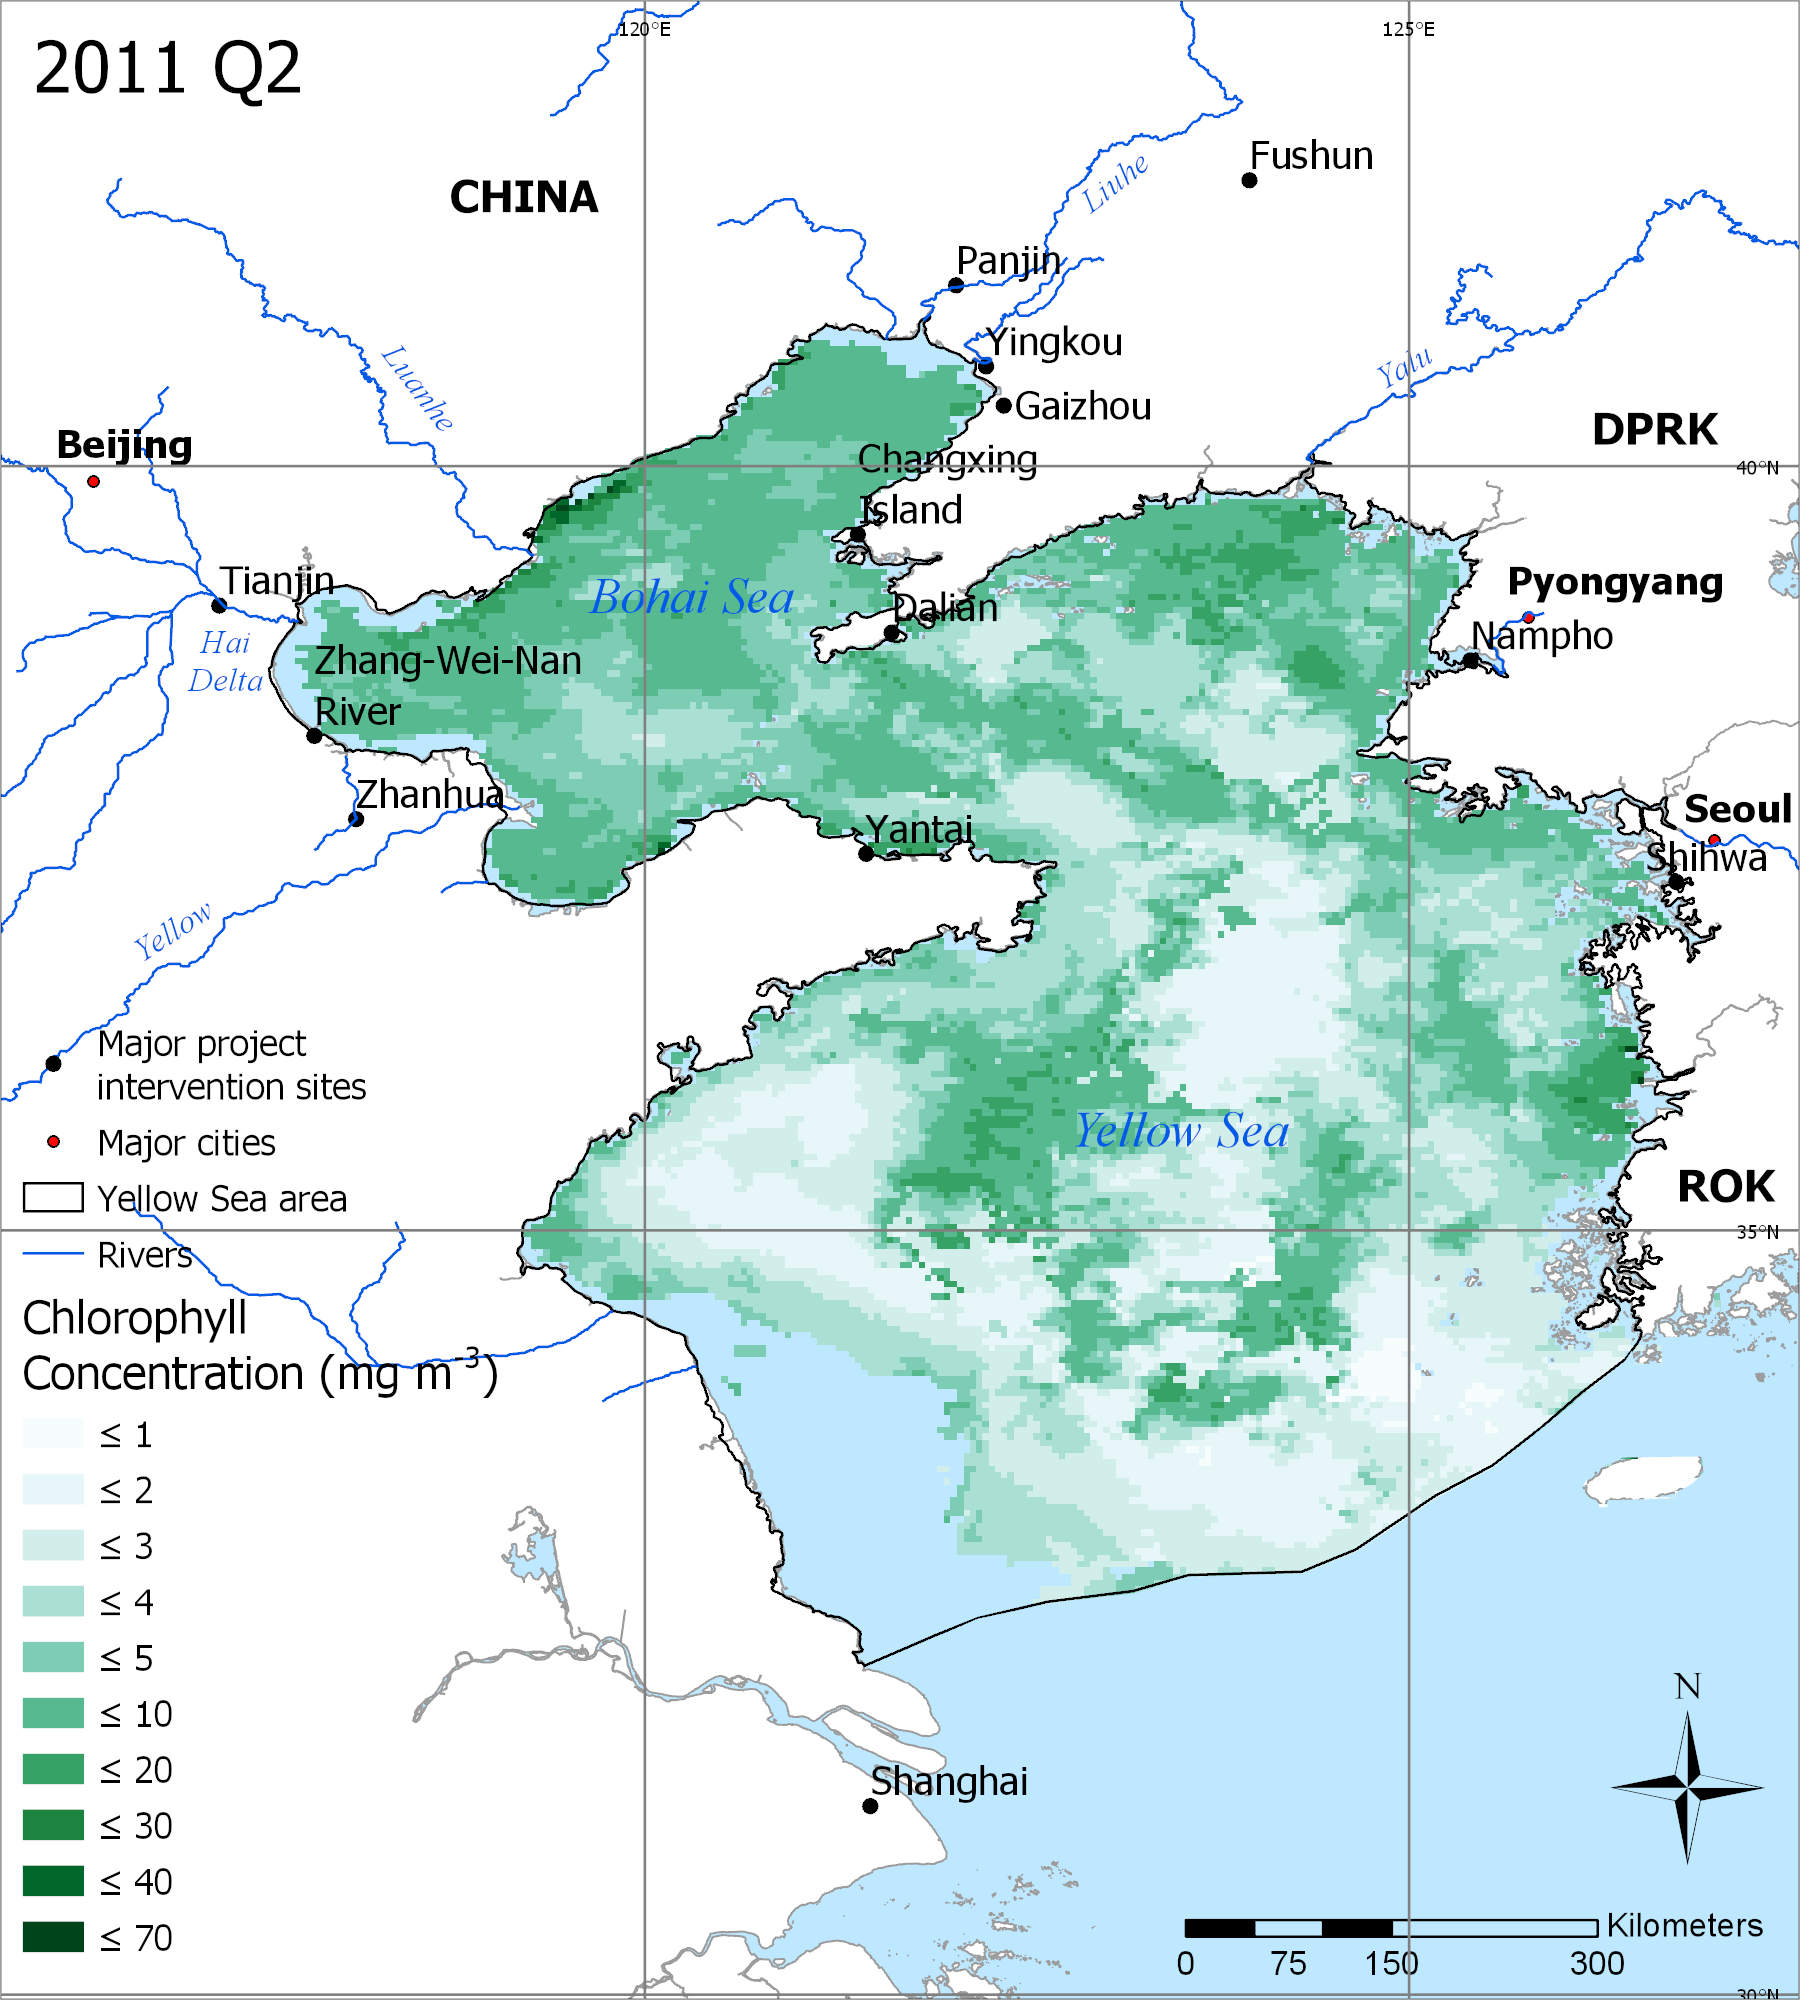
These images show remotely sensed chlorophyll levels in the Yellow Sea. In 2002, levels were lower while in 2011 levels increased.
The results showed an increase in chl-a levels from 1997-2011, followed by a decrease from 2011-2019. Complementing this analysis with interviews with project managers we were able to confirm that the policy changes, wastewater treatment and other interventions were associated with a decline in pollution levels. However, the result points to a potentially delayed impact of pollution reduction efforts—interventions to reduce marine pollution began long before the decrease in chl-a levels were detected. Outcomes and sustainability take time as demonstrated in other IEO evaluations.
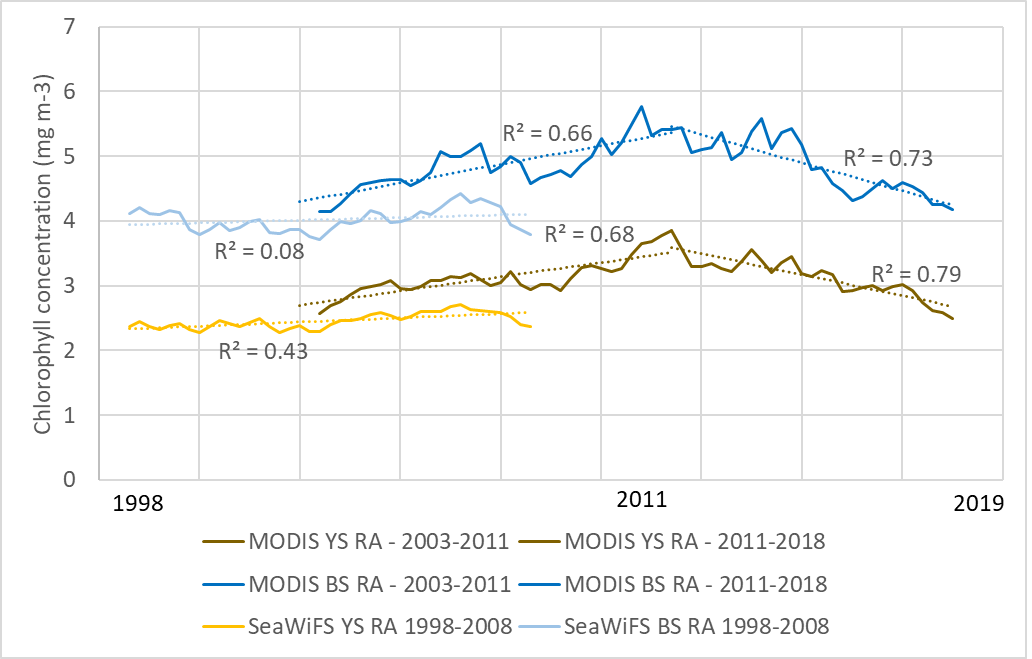
This figure shows the rolling averages (RA) over time of chlorophyll detected by the MODIS and SeaWiFS sensors for both the entire Yellow Sea (YS) and the smaller Bohai Sea (BS). Linear regressions are shown as dotted lines and their R2 values are shown.